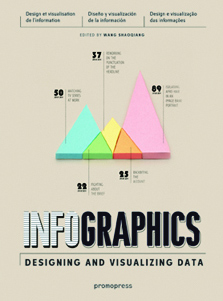
Infographics
designing and visualizing data
- ISBN: 9788415967248
- Editorial: Promopress
- Fecha de la edición: 2014
- Lugar de la edición: Barcelona. España
- Encuadernación: Cartoné
- Medidas: 28 cm
- Nº Pág.: 240
- Idiomas: Inglés

What is data visualization? And how is it different from information graphics? To put it simply, data visualization involves the creation and study of the visual representation of data. In the words of Edward Tufte: "The world is complex, dynamic, multidimensional; the paper is static, flat. How are we to represent the rich visual world of experience and measurement on mere flatland?" This is not something new; geometric diagrams and navigational maps dating from the sixteenth century are considered the predecessors of what we call infographics today. As time passed, human population and economic statistics began to be collated for governing purposes, and the subject of data visualization began to be regarded as a field in its own right.
The face of infographics has changed in the last few years with help from the Internet. The World Wide Web has seen a wave of websites dedicated to data visualization, the most famous of which is Visual.ly. In the face of increasing web saturation, however, some have come to tire of and question the fate of infographics. So what comes next? Where do we move on to from here? Do we really need to quantify everything through visuals? A new challenge has been laid out: to display complex concepts and create fresh and interesting content of incredible quality and utility. Going beyond a vague notion of aesthetics, the information presented needs to be understood not only by the aesthetically inclined, but by the average person as well.
In INFOGRAPHICS: Designing and Visualizing Data we showcase the innovative techniques used in the latest and freshest infographics, drawn from a wide range of fields of interest. Our intention is simple: to introduce advanced data-related works that push the boundaries of visual imagery. The designers of these infographics show us the world from different perspectives — data visualization has no fixed approach or form of expression. Huge possibilities are left in this field, and it is my hope that the projects presented in this book will inspire many excellent works of data visualization in the future.


